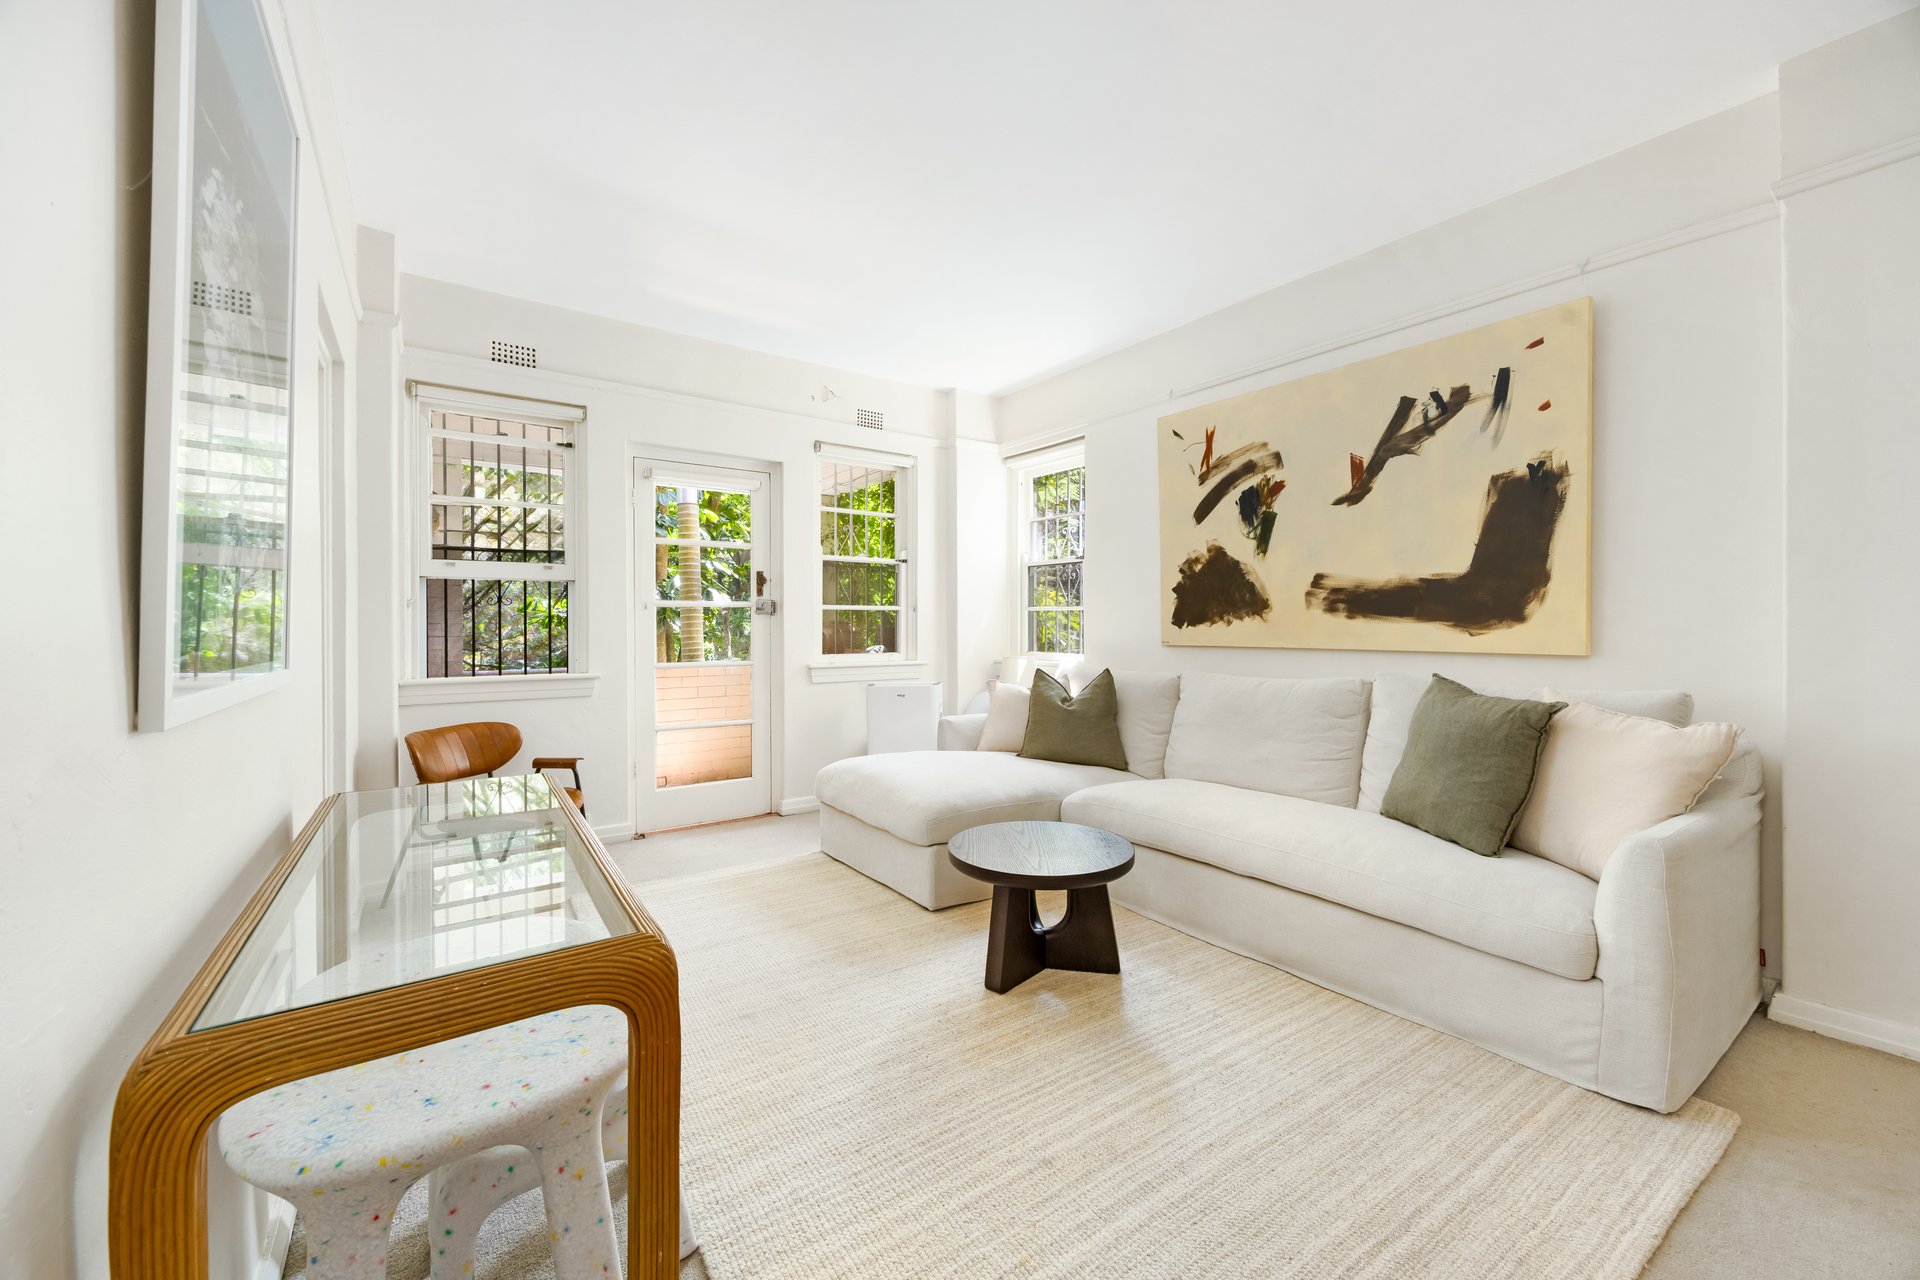
APARTMENT$1M
2/18 Kendall Street
2 bed1 bath
Area profile
NSW 2025
Area profile
NSW 2025
$2.94M
2.4%$4.80M
$1.64M
N/A
N/A
20 days
11 observed sales · stable for 14 days · through Sept 2026
June 2026 – October 2026: sale records are still arriving, so these faded bars are incomplete and their prices are not plotted yet.
Trailing three-month mean across priced sales. Each point combines that month and the previous two; windows with fewer than five priced sales remain blank.
Observed from qualified active listings to stable market outcomes.
Rolling three completed months · exact observed dates · n under 5 is marked as a small sample in the tooltip
The Woollahra property market recorded 25 sales in the latest month. The combined median sale price stands at $1,315,000. This represents a significant decrease of 35.8% compared to the same month last year. For houses, the median sale price is $3,250,000, while the median for apartments and units is $1,105,000.
Generated from Addie market data · August 2026
Asking-price drift (still listed)
Preliminary$0
Median · 108 open campaigns · 0.0% · Eastern Suburbs – North (SA3)
Showing Eastern Suburbs – North (SA3) because Woollahra has only 4 open campaigns (needs 20).
Some exclusion reasons are unavailable in this published sample · all campaign dates are inferred from observations; exact dates may differ
Open campaigns can still change; this figure is provisional.
Last asking price → sold
+$18,500
Median · 20 completed campaigns · 1.7% · Eastern Suburbs – North (SA3)
Showing Eastern Suburbs – North (SA3) because Woollahra has no completed campaigns yet (needs 20).
Some exclusion reasons are unavailable in this published sample · all sale dates are inferred from observations; exact dates may differ
First asking price → sold
+$10,000
Median · 34 completed campaigns · 1.1% · Sydney – Eastern Suburbs (SA4)
Showing Sydney – Eastern Suburbs (SA4) because Woollahra has no completed campaigns yet (needs 20).
Some exclusion reasons are unavailable in this published sample · sale dates: 2.9% publisher-reported, 97% inferred from observations
Updated 15 Nov · build 250 · price policy v3 · figures need at least 20 campaigns










Showing 24 of 45
| Agent | Sales | Avg Price | Contact |
|---|---|---|---|
| Ben Collier | 84 | $1.3M | |
| Alexander Phillips | 59 | $1.7M | |
| Ben Collier | 43 | $905K | |
| Clint Ballard | 39 | $5.8M | |
| Randall Kemp | 36 | $5.5M | |
| Ben Collier | 30 | $2.0M | |
| Alexander Phillips | 30 | $1.4M | |
| Maclay Longhurst | 28 | $5.0M | |
| Michael Pallier | 26 | N/A | |
| Jason Pantzer | 22 | $2.0M |
Safe, per resident, among NSW suburbs
3,786 incidents a year per 100,000 residents
12 months to Sep 2025 · NSW BOCSAR
Primary
Secondary
Share of the suburb inside each government school's intake zone · NSW Department of Education, 2026
+14 more listed places