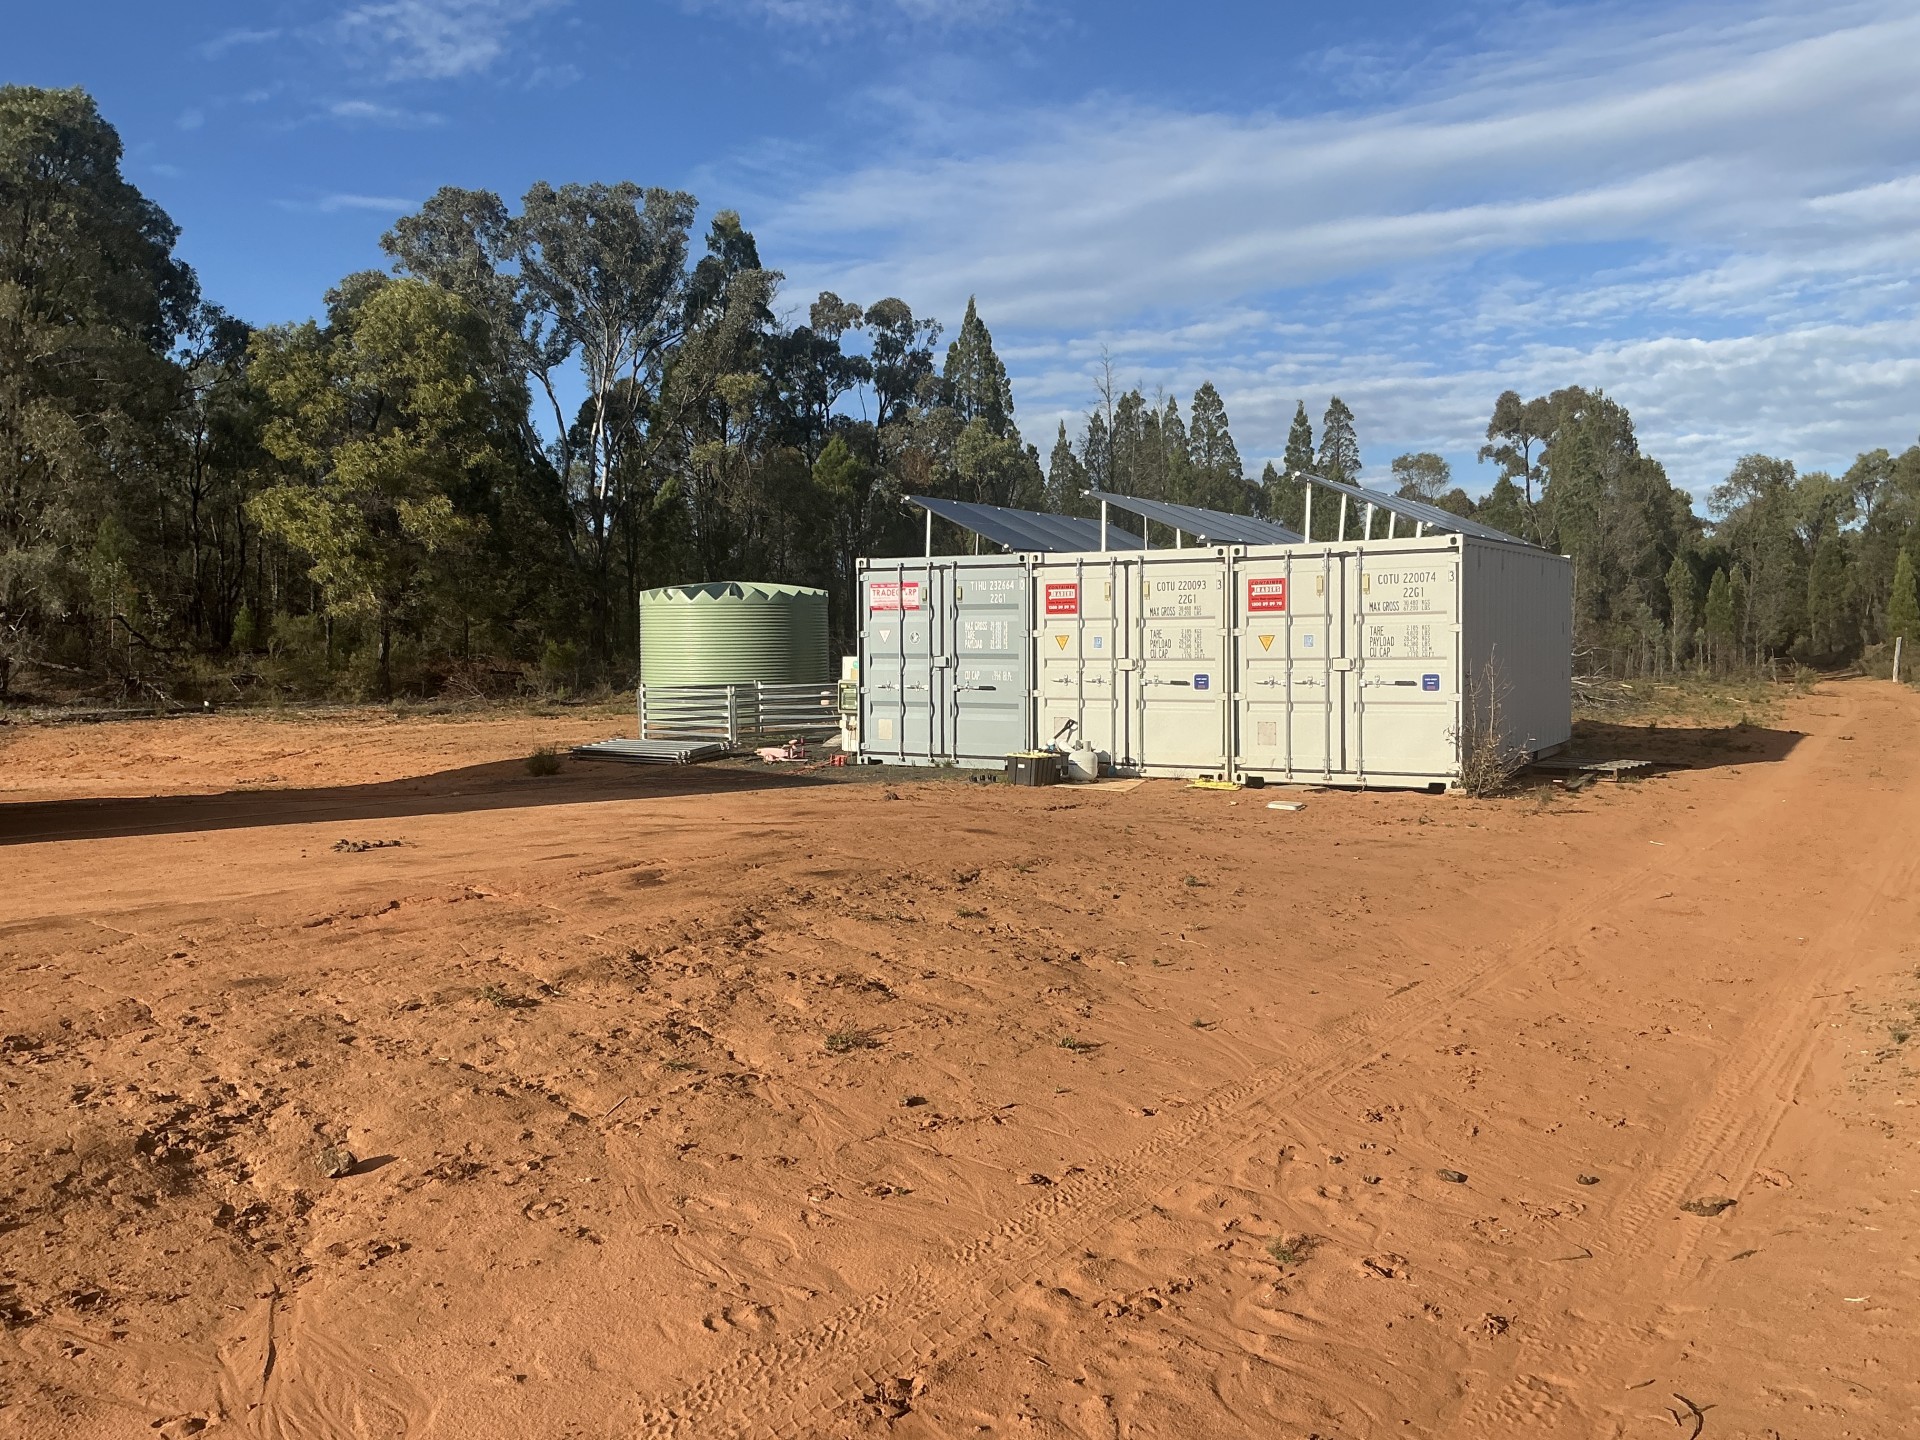
LAND$640,000
371 Bourkes and Halls Road
1,352,000 m²
Loading…
Area profile
NSW 2395
Area profile
NSW 2395


Showing 4 of 4
| Agent | Sales | Avg Price | Contact |
|---|---|---|---|
| David Grant | 15 | N/A | |
| Chris Korff | 12 | $170K | |
| Shelley Piper | 4 | $167K | |
| Paul Banks | 4 | $727K | |
| Tamara-Lee O'Neill | 3 | $31K | |
| Jane McWhirter | 3 | $173K | |
| Jane McWhirter | 3 | $173K | |
| Matt Davis | 1 | N/A | |
| Bob Proestos | 1 | $300K | |
| Private Seller | 1 | N/A | — |
Concerning, per resident, among NSW suburbs
9,663 incidents a year per 100,000 residents
12 months to Sep 2025 · NSW BOCSAR
Primary
Secondary
Share of the suburb inside each government school's intake zone · NSW Department of Education, 2026
$165K
20.3%$165K
N/A
N/A
N/A
N/A
Insufficient recent qualified campaigns
June 2026 – October 2026: sale records are still arriving, so these faded bars are incomplete and their prices are not plotted yet.
Trailing three-month mean across priced sales. Each point combines that month and the previous two; windows with fewer than five priced sales remain blank.
Observed from qualified active listings to stable market outcomes.
No qualified observed sales in this period.
The Binnaway property market recorded three sales in the latest month. The combined median sale price for the area currently stands at $170,000. For houses specifically, the median sale price is $174,000.
Generated from Addie market data · August 2026
Asking-price drift (still listed)
Preliminary$0
Median · 31 open campaigns · 0.0% · Coonabarabran (SA2)
Showing Coonabarabran (SA2) because Binnaway has only 2 open campaigns (needs 20).
Some exclusion reasons are unavailable in this published sample · all campaign dates are inferred from observations; exact dates may differ
Open campaigns can still change; this figure is provisional.
Last asking price → sold
+$10,000
Median · 35 completed campaigns · 0.8% · Dubbo (SA3)
Showing Dubbo (SA3) because Binnaway has no completed campaigns yet (needs 20).
Some exclusion reasons are unavailable in this published sample · all sale dates are inferred from observations; exact dates may differ
First asking price → sold
+$500
Median · 20 completed campaigns · 0.1% · Dubbo (SA3)
Showing Dubbo (SA3) because Binnaway has no completed campaigns yet (needs 20).
Some exclusion reasons are unavailable in this published sample · all sale dates are inferred from observations; exact dates may differ
Updated 15 Nov · build 250 · price policy v3 · figures need at least 20 campaigns